Grafanaで YAMAHAルーターRTX-1200の基本的情報を取得
Grafanaで YAMAHAルーター
RTX-1200の基本的情報を取得する
目次
snmp_exporter(v0.29.0) 設定ファイル生成用 generator.yml
先日テストした generator.yml に取得したいデータを追加していったのが以下です。
auths:
  yamaha_rt_v1_auth: # v2用の認証情報
    version: 1
    community: community # SNMPコミュニティ名を適切に設定

modules:
  rtx120:
    walk:
      - ifInOctets
      - ifOutOctets
      - yrhCpuUtil5sec
      - yrfUpTime
      - yrhMemoryUtil
      - yrhInboxTemperature
こちらの設定ファイルを元に、snmp.yml を生成しました。YAMAHA用のプライベートMIBは、実行ファイルと同じディレクトリ以下に、yamaha-private-mib を作成してこの中にコピー、明示的に標準のMIBファイル群のディレクトリとあわせて、-m オプションで指定しています。これで実行ディレクトリにsnmp.ymlが生成されます。
YAMAHAの最新の MIBSファイル群はこちらからダウンロードして展開します。
$ ./generator -m "./yamaha-private-mib:/usr/share/snmp/mibs" generate
$ cat snmp.yml
# WARNING: This file was auto-generated using snmp_exporter generator, manual changes will be lost.
auths:
  yamaha_rt_v1_auth:
    community: community
    security_level: noAuthNoPriv
    auth_protocol: MD5
    priv_protocol: DES
    version: 1
modules:
  rtx120:
    walk:
    - 1.3.6.1.2.1.2.2.1.10
    - 1.3.6.1.2.1.2.2.1.16
    get:
    - 1.3.6.1.4.1.1182.2.1.15.0
    - 1.3.6.1.4.1.1182.2.1.4.0
    - 1.3.6.1.4.1.1182.2.1.5.0
    - 1.3.6.1.4.1.1182.2.2.4.0
    metrics:
    - name: ifInOctets
      oid: 1.3.6.1.2.1.2.2.1.10
      type: counter
      help: The total number of octets received on the interface, including framing
        characters - 1.3.6.1.2.1.2.2.1.10
      indexes:
      - labelname: ifIndex
        type: gauge
    - name: ifOutOctets
      oid: 1.3.6.1.2.1.2.2.1.16
      type: counter
      help: The total number of octets transmitted out of the interface, including
        framing characters - 1.3.6.1.2.1.2.2.1.16
      indexes:
      - labelname: ifIndex
        type: gauge
    - name: yrhInboxTemperature
      oid: 1.3.6.1.4.1.1182.2.1.15
      type: gauge
      help: A temperature in the box. - 1.3.6.1.4.1.1182.2.1.15
    - name: yrhMemoryUtil
      oid: 1.3.6.1.4.1.1182.2.1.4
      type: gauge
      help: The utilization in percentage of main memory. - 1.3.6.1.4.1.1182.2.1.4
    - name: yrhCpuUtil5sec
      oid: 1.3.6.1.4.1.1182.2.1.5
      type: gauge
      help: The average utilization of CPU in 5 seconds. - 1.3.6.1.4.1.1182.2.1.5
    - name: yrfUpTime
      oid: 1.3.6.1.4.1.1182.2.2.4
      type: gauge
      help: The time (in hundredths of a second) since the network management portion
        of the system was last re-initialized - 1.3.6.1.4.1.1182.2.2.4
snmp.yml ができるので、現在使用している synology NAS用の設定が書かれている /etc/snmp_exporter/snmp.yml に追加してやりました。本体は設定ファイルの加工は非推奨ですが、小規模な内容なので手動修正で問題ありませんでした。
最後にsnmp_exporterは忘れずサービス再起動しておきます。
$ sudo systemctl restart snmp_exporter
$ sudo systemctl status snmp_exporter
● snmp_exporter.service - Prometheus SNMP Exporter
   Loaded: loaded (/etc/systemd/system/snmp_exporter.service; enabled; vendor preset: disabled)
   Active: active (running) since Mon 2025-12-08 13:12:34 JST; 1 day 19h ago
 Main PID: 1353964 (snmp_exporter)
    Tasks: 11 (limit: 23210)
   Memory: 21.0M
   CGroup: /system.slice/snmp_exporter.service
           └─1353964 /usr/local/bin/snmp_exporter --config.file=/etc/snmp_exporter/snmp.yml
Grafana ダッシュボード用JSONデータ
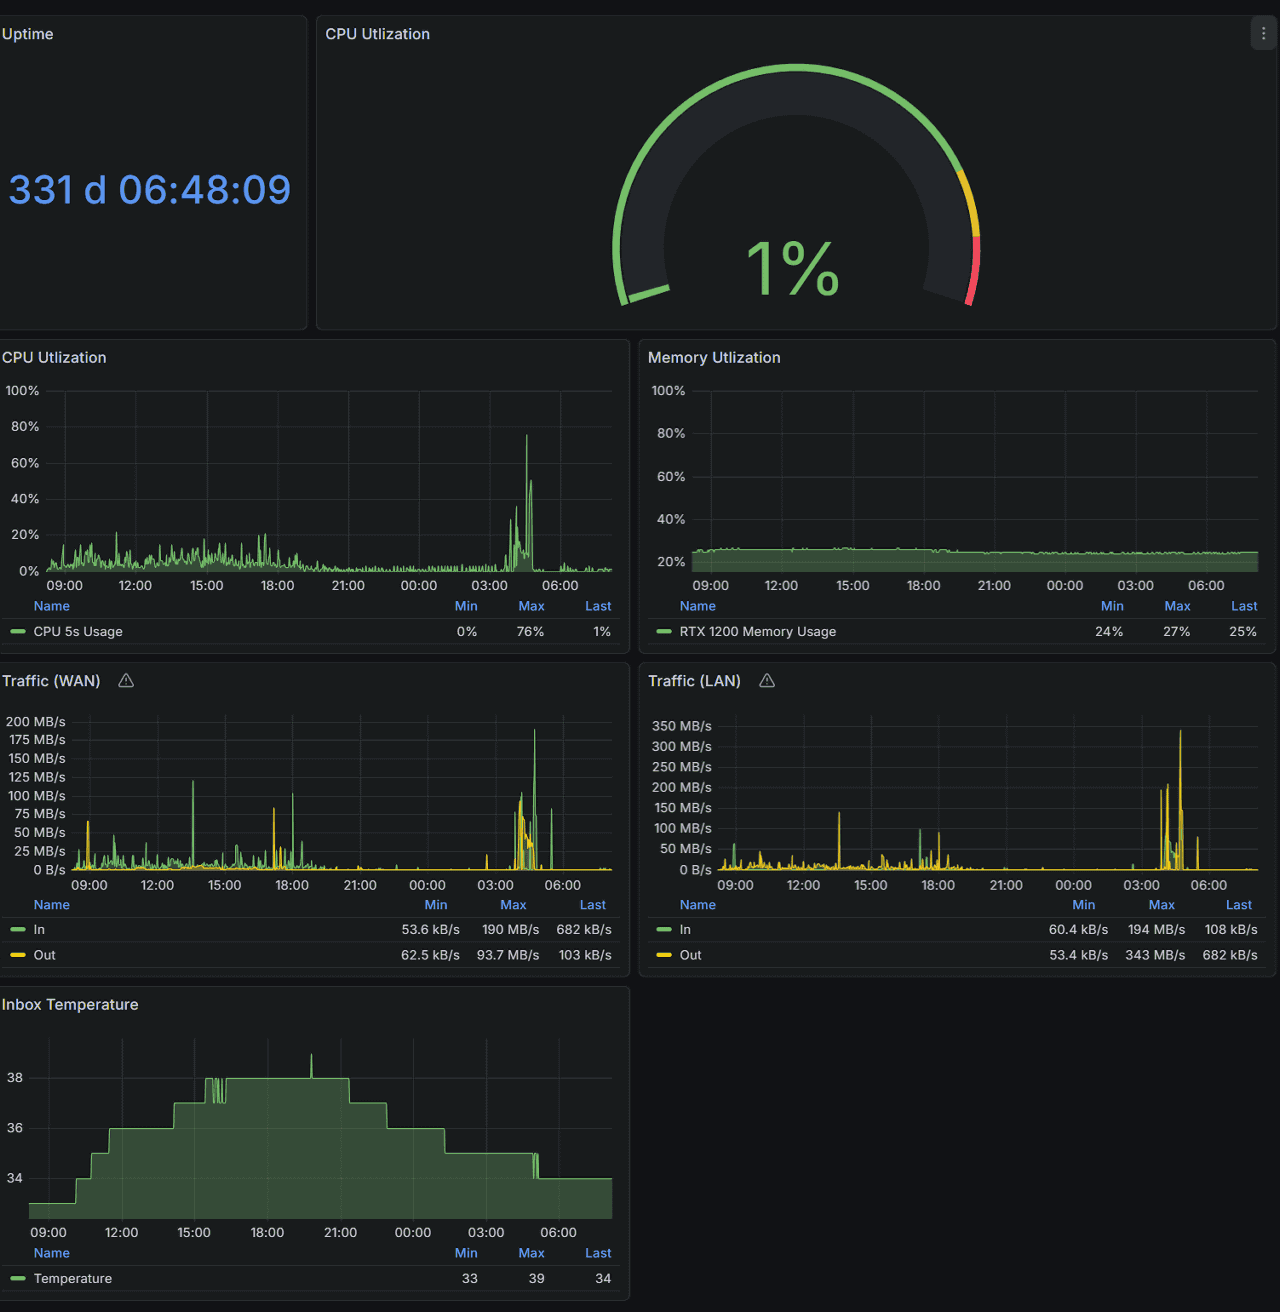
snmp_exporterで出力したデータをPrometheus経由でGrafanaに取り込みます。CPU、メモリー、LAN1、LAN2のトラフィック、本体筐体温度を集計します。
私の環境ではLAN2をWANポートとして使用しています。
取り込むダッシュボード用のJSONデータは以下です。おかしい部分は適切に加工してください。
{
"annotations": {
"list": [
{
"builtIn": 1,
"datasource": {
"type": "grafana",
"uid": "-- Grafana --"
},
"enable": true,
"hide": true,
"iconColor": "rgba(0, 211, 255, 1)",
"name": "Annotations & Alerts",
"target": {
"limit": 100,
"matchAny": false,
"tags": [],
"type": "dashboard"
},
"type": "dashboard"
}
]
},
"editable": true,
"fiscalYearStartMonth": 0,
"graphTooltip": 0,
"id": 5,
"links": [],
"panels": [
{
"datasource": {
"type": "prometheus",
"uid": "cf6667qjd5hc0e"
},
"fieldConfig": {
"defaults": {
"color": {
"fixedColor": "blue",
"mode": "fixed"
},
"mappings": [],
"thresholds": {
"mode": "absolute",
"steps": [
{
"color": "green",
"value": 0
}
]
},
"unit": "dtdhms"
},
"overrides": []
},
"gridPos": {
"h": 8,
"w": 6,
"x": 0,
"y": 0
},
"id": 18,
"options": {
"colorMode": "value",
"graphMode": "none",
"justifyMode": "auto",
"orientation": "auto",
"percentChangeColorMode": "standard",
"reduceOptions": {
"calcs": [
"lastNotNull"
],
"fields": "",
"values": false
},
"showPercentChange": false,
"textMode": "auto",
"wideLayout": true
},
"pluginVersion": "12.3.0",
"targets": [
{
"datasource": {
"type": "prometheus",
"uid": "cf6667qjd5hc0e"
},
"editorMode": "builder",
"expr": "yrfUpTime / 100",
"legendFormat": "__auto",
"range": true,
"refId": "A"
}
],
"title": "Uptime",
"type": "stat"
},
{
"datasource": {
"type": "prometheus",
"uid": "cf6667qjd5hc0e"
},
"fieldConfig": {
"defaults": {
"color": {
"mode": "thresholds"
},
"mappings": [],
"max": 100,
"min": 0,
"thresholds": {
"mode": "percentage",
"steps": [
{
"color": "green",
"value": 0
},
{
"color": "#EAB839",
"value": 80
},
{
"color": "red",
"value": 90
}
]
},
"unit": "percent"
},
"overrides": [
{
"matcher": {
"id": "byName",
"options": "{__name__=\"yrhMultiCpuUtil5sec\", instance=\"192.168.15.1\", job=\"snmp-rtx1200\", name=\"rtx1200\", vendor=\"yamaha\", yrhMultiCpuIndex=\"1\"}"
},
"properties": [
{
"id": "displayName",
"value": "CPU 0"
}
]
},
{
"matcher": {
"id": "byName",
"options": "{__name__=\"yrhMultiCpuUtil5sec\", instance=\"192.168.15.1\", job=\"snmp-rtx1200\", name=\"rtx1200\", vendor=\"yamaha\", yrhMultiCpuIndex=\"2\"}"
},
"properties": [
{
"id": "displayName",
"value": "CPU 1"
}
]
},
{
"matcher": {
"id": "byName",
"options": "{__name__=\"yrhMultiCpuUtil5sec\", instance=\"192.168.15.1\", job=\"snmp-rtx1200\", name=\"rtx1200\", vendor=\"yamaha\", yrhMultiCpuIndex=\"3\"}"
},
"properties": [
{
"id": "displayName",
"value": "CPU 2"
}
]
},
{
"matcher": {
"id": "byName",
"options": "{__name__=\"yrhMultiCpuUtil5sec\", instance=\"192.168.15.1\", job=\"snmp-rtx1200\", name=\"rtx1200\", vendor=\"yamaha\", yrhMultiCpuIndex=\"4\"}"
},
"properties": [
{
"id": "displayName",
"value": "CPU 4"
}
]
}
]
},
"gridPos": {
"h": 8,
"w": 18,
"x": 6,
"y": 0
},
"id": 8,
"options": {
"minVizHeight": 75,
"minVizWidth": 75,
"orientation": "auto",
"reduceOptions": {
"calcs": [
"lastNotNull"
],
"fields": "",
"values": false
},
"showThresholdLabels": false,
"showThresholdMarkers": true,
"sizing": "auto"
},
"pluginVersion": "12.3.0",
"targets": [
{
"datasource": {
"type": "prometheus",
"uid": "cf6667qjd5hc0e"
},
"editorMode": "builder",
"expr": "yrhCpuUtil5sec",
"legendFormat": "__auto",
"range": true,
"refId": "A"
}
],
"title": "CPU Utlization",
"type": "gauge"
},
{
"datasource": {
"type": "prometheus",
"uid": "cf6667qjd5hc0e"
},
"fieldConfig": {
"defaults": {
"color": {
"mode": "palette-classic"
},
"custom": {
"axisBorderShow": false,
"axisCenteredZero": false,
"axisColorMode": "text",
"axisLabel": "",
"axisPlacement": "auto",
"barAlignment": 0,
"barWidthFactor": 0.6,
"drawStyle": "line",
"fillOpacity": 30,
"gradientMode": "none",
"hideFrom": {
"legend": false,
"tooltip": false,
"viz": false
},
"insertNulls": false,
"lineInterpolation": "smooth",
"lineWidth": 1,
"pointSize": 5,
"scaleDistribution": {
"type": "linear"
},
"showPoints": "auto",
"showValues": false,
"spanNulls": false,
"stacking": {
"group": "A",
"mode": "none"
},
"thresholdsStyle": {
"mode": "off"
}
},
"mappings": [],
"max": 100,
"thresholds": {
"mode": "absolute",
"steps": [
{
"color": "green",
"value": 0
}
]
},
"unit": "percent"
},
"overrides": [
{
"matcher": {
"id": "byName",
"options": "yrhCpuUtil5sec"
},
"properties": [
{
"id": "displayName",
"value": "CPU 5s Usage"
}
]
}
]
},
"gridPos": {
"h": 8,
"w": 12,
"x": 0,
"y": 8
},
"id": 11,
"options": {
"legend": {
"calcs": [
"min",
"max",
"last"
],
"displayMode": "table",
"placement": "bottom",
"showLegend": true
},
"tooltip": {
"hideZeros": false,
"mode": "single",
"sort": "none"
}
},
"pluginVersion": "12.3.0",
"targets": [
{
"datasource": {
"type": "prometheus",
"uid": "cf6667qjd5hc0e"
},
"editorMode": "builder",
"expr": "yrhCpuUtil5sec",
"legendFormat": "__auto",
"range": true,
"refId": "A"
}
],
"title": "CPU Utlization",
"type": "timeseries"
},
{
"datasource": {
"type": "prometheus",
"uid": "cf6667qjd5hc0e"
},
"fieldConfig": {
"defaults": {
"color": {
"mode": "palette-classic"
},
"custom": {
"axisBorderShow": false,
"axisCenteredZero": false,
"axisColorMode": "text",
"axisLabel": "",
"axisPlacement": "auto",
"barAlignment": 0,
"barWidthFactor": 0.6,
"drawStyle": "line",
"fillOpacity": 30,
"gradientMode": "none",
"hideFrom": {
"legend": false,
"tooltip": false,
"viz": false
},
"insertNulls": false,
"lineInterpolation": "smooth",
"lineWidth": 1,
"pointSize": 5,
"scaleDistribution": {
"type": "linear"
},
"showPoints": "auto",
"showValues": false,
"spanNulls": false,
"stacking": {
"group": "A",
"mode": "none"
},
"thresholdsStyle": {
"mode": "off"
}
},
"mappings": [],
"max": 100,
"thresholds": {
"mode": "absolute",
"steps": [
{
"color": "green",
"value": 0
}
]
},
"unit": "percent"
},
"overrides": [
{
"matcher": {
"id": "byName",
"options": "yrhMemoryUtil"
},
"properties": [
{
"id": "displayName",
"value": "RTX 1200 Memory Usage"
}
]
}
]
},
"gridPos": {
"h": 8,
"w": 12,
"x": 12,
"y": 8
},
"id": 10,
"options": {
"legend": {
"calcs": [
"min",
"max",
"last"
],
"displayMode": "table",
"placement": "bottom",
"showLegend": true
},
"tooltip": {
"hideZeros": false,
"mode": "single",
"sort": "none"
}
},
"pluginVersion": "12.3.0",
"targets": [
{
"datasource": {
"type": "prometheus",
"uid": "cf6667qjd5hc0e"
},
"editorMode": "builder",
"expr": "yrhMemoryUtil",
"legendFormat": "__auto",
"range": true,
"refId": "A"
}
],
"title": "Memory Utlization",
"type": "timeseries"
},
{
"datasource": {
"type": "prometheus",
"uid": "cf6667qjd5hc0e"
},
"fieldConfig": {
"defaults": {
"color": {
"mode": "palette-classic"
},
"custom": {
"axisBorderShow": false,
"axisCenteredZero": false,
"axisColorMode": "text",
"axisLabel": "",
"axisPlacement": "auto",
"barAlignment": 0,
"barWidthFactor": 0.6,
"drawStyle": "line",
"fillOpacity": 30,
"gradientMode": "none",
"hideFrom": {
"legend": false,
"tooltip": false,
"viz": false
},
"insertNulls": false,
"lineInterpolation": "smooth",
"lineWidth": 1,
"pointSize": 5,
"scaleDistribution": {
"type": "linear"
},
"showPoints": "auto",
"showValues": false,
"spanNulls": false,
"stacking": {
"group": "A",
"mode": "none"
},
"thresholdsStyle": {
"mode": "off"
}
},
"mappings": [],
"thresholds": {
"mode": "absolute",
"steps": [
{
"color": "green",
"value": 0
},
{
"color": "red",
"value": 80
}
]
},
"unit": "Bps"
},
"overrides": [
{
"matcher": {
"id": "byFrameRefID",
"options": "A"
},
"properties": [
{
"id": "displayName",
"value": "In"
}
]
},
{
"matcher": {
"id": "byFrameRefID",
"options": "B"
},
"properties": [
{
"id": "displayName",
"value": "Out"
}
]
}
]
},
"gridPos": {
"h": 8,
"w": 12,
"x": 0,
"y": 16
},
"id": 19,
"options": {
"legend": {
"calcs": [
"min",
"max",
"last"
],
"displayMode": "table",
"placement": "bottom",
"showLegend": true
},
"tooltip": {
"hideZeros": false,
"mode": "single",
"sort": "none"
}
},
"pluginVersion": "12.3.0",
"targets": [
{
"datasource": {
"type": "prometheus",
"uid": "cf6667qjd5hc0e"
},
"editorMode": "builder",
"exemplar": false,
"expr": "rate(ifInOctets{ifIndex=\"2\"}[1m]) * 8",
"format": "time_series",
"instant": false,
"interval": "",
"legendFormat": "__auto",
"range": true,
"refId": "A"
},
{
"datasource": {
"type": "prometheus",
"uid": "cf6667qjd5hc0e"
},
"editorMode": "builder",
"expr": "rate(ifOutOctets{ifIndex=\"2\"}[1m]) * 8",
"hide": false,
"legendFormat": "__auto",
"range": true,
"refId": "B"
}
],
"title": "Traffic (WAN)",
"type": "timeseries"
},
{
"datasource": {
"type": "prometheus",
"uid": "cf6667qjd5hc0e"
},
"fieldConfig": {
"defaults": {
"color": {
"mode": "palette-classic"
},
"custom": {
"axisBorderShow": false,
"axisCenteredZero": false,
"axisColorMode": "text",
"axisLabel": "",
"axisPlacement": "auto",
"barAlignment": 0,
"barWidthFactor": 0.6,
"drawStyle": "line",
"fillOpacity": 30,
"gradientMode": "none",
"hideFrom": {
"legend": false,
"tooltip": false,
"viz": false
},
"insertNulls": false,
"lineInterpolation": "smooth",
"lineWidth": 1,
"pointSize": 5,
"scaleDistribution": {
"type": "linear"
},
"showPoints": "auto",
"showValues": false,
"spanNulls": false,
"stacking": {
"group": "A",
"mode": "none"
},
"thresholdsStyle": {
"mode": "off"
}
},
"mappings": [],
"thresholds": {
"mode": "absolute",
"steps": [
{
"color": "green",
"value": 0
}
]
},
"unit": "Bps"
},
"overrides": [
{
"matcher": {
"id": "byFrameRefID",
"options": "A"
},
"properties": [
{
"id": "displayName",
"value": "In"
}
]
},
{
"matcher": {
"id": "byFrameRefID",
"options": "B"
},
"properties": [
{
"id": "displayName",
"value": "Out"
}
]
}
]
},
"gridPos": {
"h": 8,
"w": 12,
"x": 12,
"y": 16
},
"id": 20,
"options": {
"legend": {
"calcs": [
"min",
"max",
"last"
],
"displayMode": "table",
"placement": "bottom",
"showLegend": true
},
"tooltip": {
"hideZeros": false,
"mode": "single",
"sort": "none"
}
},
"pluginVersion": "12.3.0",
"targets": [
{
"datasource": {
"type": "prometheus",
"uid": "cf6667qjd5hc0e"
},
"editorMode": "builder",
"exemplar": false,
"expr": "rate(ifInOctets{ifIndex=\"1\"}[1m]) * 8",
"format": "time_series",
"instant": false,
"interval": "",
"legendFormat": "__auto",
"range": true,
"refId": "A"
},
{
"datasource": {
"type": "prometheus",
"uid": "cf6667qjd5hc0e"
},
"editorMode": "builder",
"expr": "rate(ifOutOctets{ifIndex=\"1\"}[1m]) * 8",
"hide": false,
"legendFormat": "__auto",
"range": true,
"refId": "B"
}
],
"title": "Traffic (LAN)",
"type": "timeseries"
},
{
"datasource": {
"type": "prometheus",
"uid": "cf6667qjd5hc0e"
},
"fieldConfig": {
"defaults": {
"color": {
"mode": "palette-classic"
},
"custom": {
"axisBorderShow": false,
"axisCenteredZero": false,
"axisColorMode": "text",
"axisLabel": "",
"axisPlacement": "auto",
"barAlignment": 0,
"barWidthFactor": 0.6,
"drawStyle": "line",
"fillOpacity": 30,
"gradientMode": "none",
"hideFrom": {
"legend": false,
"tooltip": false,
"viz": false
},
"insertNulls": false,
"lineInterpolation": "smooth",
"lineWidth": 1,
"pointSize": 5,
"scaleDistribution": {
"type": "linear"
},
"showPoints": "auto",
"showValues": false,
"spanNulls": false,
"stacking": {
"group": "A",
"mode": "none"
},
"thresholdsStyle": {
"mode": "off"
}
},
"mappings": [],
"thresholds": {
"mode": "absolute",
"steps": [
{
"color": "green",
"value": 0
}
]
},
"unit": "none"
},
"overrides": [
{
"matcher": {
"id": "byName",
"options": "yrhInboxTemperature"
},
"properties": [
{
"id": "displayName",
"value": "Temperature"
}
]
}
]
},
"gridPos": {
"h": 8,
"w": 12,
"x": 0,
"y": 24
},
"id": 21,
"options": {
"legend": {
"calcs": [
"min",
"max",
"last"
],
"displayMode": "table",
"placement": "bottom",
"showLegend": true
},
"tooltip": {
"hideZeros": false,
"mode": "single",
"sort": "none"
}
},
"pluginVersion": "12.3.0",
"targets": [
{
"datasource": {
"type": "prometheus",
"uid": "cf6667qjd5hc0e"
},
"editorMode": "builder",
"expr": "yrhInboxTemperature",
"legendFormat": "__auto",
"range": true,
"refId": "A"
}
],
"title": "Inbox Temperature",
"type": "timeseries"
}
],
"preload": false,
"refresh": "1m",
"schemaVersion": 42,
"tags": [
"Router"
],
"templating": {
"list": []
},
"time": {
"from": "now-24h",
"to": "now"
},
"timepicker": {},
"timezone": "Asia/Tokyo",
"title": "rtx1200",
"uid": "eEntLKSVz2",
"version": 13,
"weekStart": "sunday"
}
SNMPのデータも良い感じに管理できるようになりました
まずはRTX-1200のデータを可視化してみましたが、他にもRTX-830も設置してあるので、そちら用のダッシュボードも後日作成予定です。RTX-830については本体筐体の温度取得ができないようなので、よりシンプルな構成になりますね。

コメント